Preface
Nearly 3 years ago I have bought myself a PogoplugV2 (see Post). It is still an awesome device for this price and worked without any issue the whole time.
However it is time for an upgrade. USB 2.0 was a little bit too slow for me (~30MB/s). In addition I have a lot of external USB 3.0 HDDs and it is time to use their full potential. So there are 4 key points a device needs to become my next NAS (Network-attached storage) and home server system:
- reasonable fast ARM processor with at least 2 cores (I prefer ARM over x86 for this use case because of its low energy consumption)
- Gigabit ethernet
- at least 2 USB 3.0 ports because I want to attach 2 active 4-port USB hubs. Almost all USB hubs >4 ports are cascaded 4 port hubs. This is quite bad because it can cause a lot of compatibility and of course performance issues.
- all together <150€. I do not want to pay 300-400€ for a simple NAS with USB disks…
ODROID-XU4
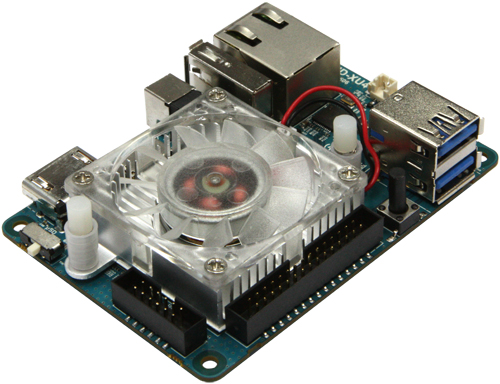
After a bit of research I have bought an ODROID-XU4.
Let’s look at the specs:
 Samsung Exynos5422 Cortex™-A15 2Ghz and Cortex™-A7 Octa core CPUs
- Mali-T628 MP6(OpenGL ES 3.0/2.0/1.1 and OpenCL 1.1 Full profile)
- 2Gbyte LPDDR3 RAM PoP stacked
- eMMC5.0 HS400 Flash Storage
- 2 x USB 3.0 Host, 1 x USB 2.0 Host
- Gigabit Ethernet port
- HDMI 1.4a for display
- Size : 82 x 58 x 22 mm
- Price: ~80 € + PSU ~8 € + Case ~8€ = ~96 €

I do not need the GPU and display output but whatever… the price is quite good for this performance. It is less expensive in US than it is in germany. But that is always the case 😉
Additional equipment
I am using a microSD Card for OS because eMMC is quite expensive. Boot times and program loading times are not that important my use case.
With two additional 4 port active USB 3.0 hubs I have 8 USB 3.0 ports and 1 USB 2.0 port. At the moment 5 disks are connected with a total of 7.5 TB storage.
Connecting a 2 TB disk to each USB 3.0 port would be 16 TB storage which should be good enough for some time.
- SanDisk Extreme 32GB microSDHC UHS-I ~20 €
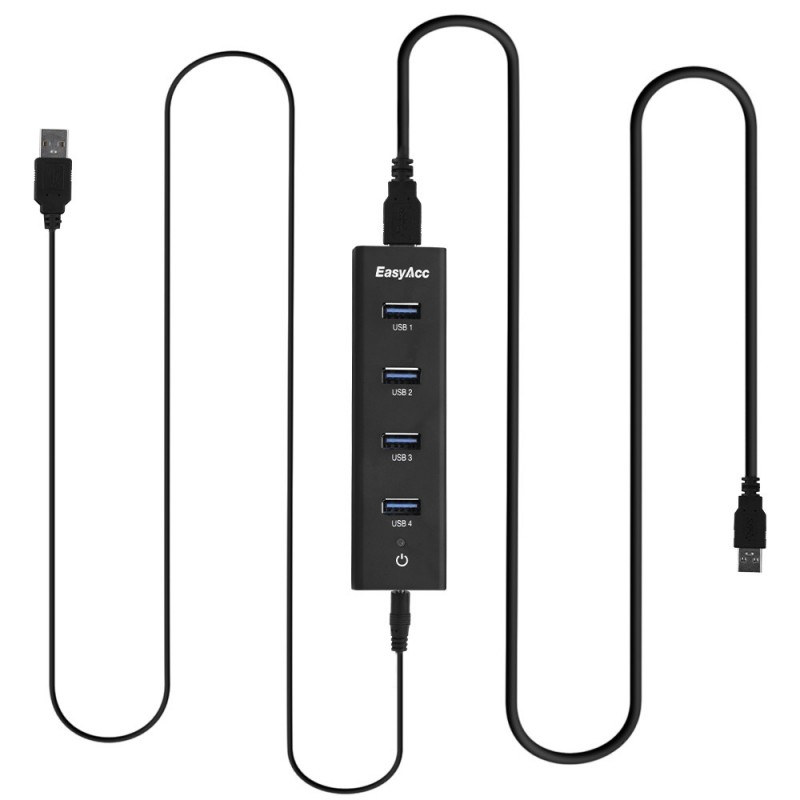
- 2x EasyAcc® Superspeed USB 3.0 4 Port Bus-Powered and Self-Powered 2-in-1 Hub 2x ~11 €
- Anker 20W Dual-Port USB Wall Charger to power USB Hubs ~10 €


OS Choices
The ODROID-XU4 SOC is the same as its predecessor ODROID-XU3. That is why they share a common kernel and os images are compatible.
Nevertheless Exynos5422 SOC is not fully integrated in mainline kernel yet. That is why you have to use a custom kernel from hardkernel. But that is not a big issue because there a quite a few OS choices with the custom kernel like Android (ofc pretty useless for NAS), Ubuntu 15.04, Arch Linux, Fedora, Kali Linux, …
Also I really like Arch Linux I have chosen a different path this time. There is OpenMediaVault (OMV) for some Odroids. I thought hey let’s give it a try the web interface looks quite nice.
After a few days I can say I really like it. The web interface is really good and looks modern.
OMV is running on Debian Wheezy 7.9.
Installation
Download OpenMediaVault Image from: http://sourceforge.net/projects/openmediavault/files/Odroid-XU3_XU4/
Extract the downloaded image
gunzip -d omv_2.1.1_xu3_xu4.img.gz
Search for the path of your microSD Card with lsblk or sudo fdisk -l
Write the image to your microSD card with the following commands:
sudo dd if=omv_2.1.1_xu3_xu4.img of=/dev/<Your_SD> bs=4096
sync
Insert your microSD card and power your Odroid.
Then you can login via SSH or web interface:
SSH
username: root
password: odroid
Web interface
username: admin
password: openmediavault
I will not go into detail on how to configure stuff in the web interface because that is really easy and straightforward. I will focus on optimizing performance and adding a few neat features.
Basic configuration
Connect to your Odroid via SSH with default login credentials (see above).
Afterwards change your root password with passwd
You should change your web interface password, too.
Colorful Shell
Because we will use the shell for quite some time let’s add some color to it:
vi ~/.bashrc and comment out the following lines:
# You may uncomment the following lines if you want `ls' to be colorized:
export LS_OPTIONS='--color=auto'
eval "`dircolors`"
alias ls='ls $LS_OPTIONS'
alias ll='ls $LS_OPTIONS -l'
alias l='ls $LS_OPTIONS -lA'
vi /etc/vim/vimrc and comment out the following line:
syntax on
and some more set’s from the bottom of the file as you like.
Note: If you are not familiar with vi/vim you can use nano to edit all files.
Performance tuning
Performance with default settings was really bad. Disk read and write was around 30MB/s to ext4 and SSH was laggy. After a few minutes I have found the issue. Per default OMV sets the conservative governor. This may work well with x86 CPUs or other ARM CPUs but with Odroid it is a pain.
In the web interface under “Power Management” is an option called “Monitoring – Specifies whether to monitor the system status and select the most appropriate CPU level.” This sounds quite good, problem is this option sets the cpu governor to conservative. Conservative governor with default settings works really bad on Odroid in combination with I/O.
Disabling this option sets governor to performance. All 8 cores at max clock speed the whole time produce quite a bit of heat (fan spinning a lot) and it is not really energy efficient.
CPU governor
But no problem we can change the governor to ondemand and with a little bit tuning your Odroid will fly. The following settings will replace conservative with ondemand governor if you enable the Power Management option.
vi /etc/default/openmediavault and append the following lines to this file:
# Ondemand Scheduler
OMV_CPUFREQUTILS_GOVERNOR="ondemand"
Then regenerate the config with
omv-mkconf cpufrequtils
Note: There seems to be a bug in OpenMediaVault. After disabling Power Management and enabling it again it does not change cpu governor anymore. To fix this do the following:
update-rc.d cpufrequtils defaults
Ondemand governor tuning
I did a few benchmarks and this showed I/O performance (my main focus) depends a lot on the cpu frequency. Therefore we further have to tune ondemand governor to get full I/O throughput. To do so do the following:
apt-get install sysfsutils
vi /etc/sysfs.conf
Copy the following to this file
# cpu0 sets cpu[0-3], cpu4 sets cpu[4-7]
devices/system/cpu/cpu0/cpufreq/ondemand/io_is_busy = 1
devices/system/cpu/cpu4/cpufreq/ondemand/io_is_busy = 1
devices/system/cpu/cpu0/cpufreq/ondemand/sampling_down_factor = 10
devices/system/cpu/cpu4/cpufreq/ondemand/sampling_down_factor = 10
devices/system/cpu/cpu0/cpufreq/ondemand/up_threshold = 80
devices/system/cpu/cpu4/cpufreq/ondemand/up_threshold = 80
Afterwards change to ondemand governor and activate these values with
cpufreq-set -g ondemand -c 0
cpufreq-set -g ondemand -c 4
service sysfsutils start
I did benchmarks with all these settings and for me this is the sweet spot. Nearly same performance as performance governor but lower frequency and less power consumption when idle.
Some explanation of all 3 settings:
sampling_down_factor: this parameter controls the rate at which the kernel makes a decision on when to decrease the frequency while running at top speed. When set to 1 (the default) decisions to reevaluate load are made at the same interval regardless of current clock speed. But when set to greater than 1 (e.g. 100) it acts as a multiplier for the scheduling interval for reevaluating load when the CPU is at its top speed due to high load. This improves performance by reducing the overhead of load evaluation and helping the CPU stay at its top speed when truly busy, rather than shifting back and forth in speed. This tunable has no effect on behavior at lower speeds/lower CPU loads.
up_threshold: defines what the average CPU usage between the samplings of ‘sampling_rate’ needs to be for the kernel to make a decision on whether it should increase the frequency. For example when it is set to its default value of ’95’ it means that between the checking intervals the CPU needs to be on average more than 95% in use to then decide that the CPU frequency needs to be increased.
io_is_busy: if 1 waiting for I/O will increase the calculated cpu usage. The governor will calculate iowait as busy and not idle time. Thus cpu will reach higher frequencies faster with I/O load.
NTFS mount options
Besides the ondemand governor we will add the big_writes mount option to all NTFS mounts. In addition we will add noatime.
big_writes: this option prevents fuse from splitting write buffers into 4K chunks, enabling big write buffers to be transferred from the application in a single step (up to some system limit, generally 128K bytes).
noatime this option disables inode access time updates which can speed up file operations and prevent sleeping (notebook) disks spinning up too often thus saving energy and disk lifetime.
vi /etc/default/openmediavault and append the following
# Optimize NTFS Performance
OMV_FSTAB_MNTOPS_NTFS="defaults,nofail,noexec,noatime,big_writes"
Then you have to unmount, apply, mount, apply all your NTFS volumes in the web interface.
With default mount options you get around 16 MB/s write. With big_writes you get up to 62 MB/s write. See this comparison below:
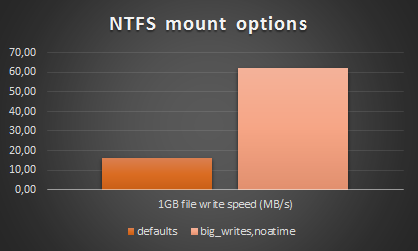
This looks fairly fast but keep in mind NTFS is very cpu intensive on such a system. Therefore real network throughput via samba (which is cpu heavy as well) is way less compared to a native linux filesystem. I tested this disk with samba and measured only ~30MB/s read and write speeds. This is considerably less than a native linux filesystem (see Samba benchmarks).
If you want to get full performance you have to use a native linux filesystem like ext4 or xfs. You really should!
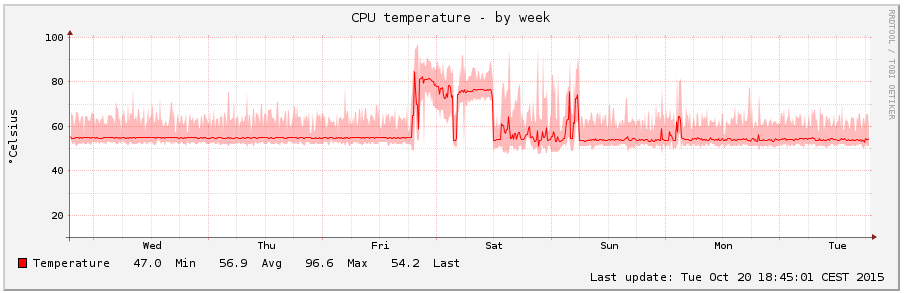
More Monitoring
I really like the monitoring setup of OMV with rrdtool. Nevertheless I miss 2 graphs which I am interested in. It would be nice to have CPU frequency and CPU temperature graphs, therefore I extended the existing monitoring plugin.
Monitoring cpu frequency is no big deal because there is a native collectd plugin for CPU frequency. For CPU temperature we have to write our own collectd plugin which looks like this:
#!/bin/sh

# Read CPU temperature of ODROID-XU3/4
# There are 2 sensors available:
# /sys/devices/virtual/thermal/thermal_zone0/temp
# /sys/devices/10060000.tmu/temp

HOSTNAME="${COLLECTD_HOSTNAME:-localhost}"
INTERVAL="${COLLECTD_INTERVAL:-60}"

while sleep "$INTERVAL"; do
	VALUE="$(($(cat /sys/devices/virtual/thermal/thermal_zone0/temp)/1000))"
	if [ $? -ne 0 ]; then
		VALUE="U"
	fi
	echo "PUTVAL \"$HOSTNAME/temperature/temperature-cpu\" interval=$INTERVAL N:$VALUE"
done
In addition to the script above you have to create new collectd configs and additional tabs in the web interface. I have done all that and uploaded the full sourcecode (including the script above) to GitHub: https://github.com/Obihoernchen/openmediavault-monitoring-odroid-xu4
Install these CPU frequency and temperature monitoring plugins with the following commands:
cd /tmp
wget https://github.com/Obihoernchen/openmediavault-monitoring-odroid-xu4/archive/master.zip
unzip master.zip
cd openmediavault-monitoring-odroid-xu4-master
cp -R usr/* /usr
cp -R var/* /var
rm -r /tmp/openmediavault-monitoring-odroid-xu4-master

chmod +x /usr/local/bin/cputemp /usr/share/openmediavault/mkconf/collectd.d/cpu{freq,temp}
omv-mkconf collectd

chown openmediavault:openmediavault /var/www/openmediavault/js/omv/module/admin/diagnostic/system/plugin/Cpu{Temperature,Frequency}.js
chmod 644 /var/www/openmediavault/js/omv/module/admin/diagnostic/system/plugin/Cpu{Temperature,Frequency}.js

source /usr/share/openmediavault/scripts/helper-functions && omv_purge_internal_cache
The default diagrams are a little small for my taste, that is why I have increased the size a bit:
vi /etc/default/openmediavault and add the following to this file
# RRDTool graph width and height
OMV_COLLECTD_RRDTOOL_GRAPH_WIDTH=800
OMV_COLLECTD_RRDTOOL_GRAPH_HEIGHT=200
Afterwards update OMV’s config files with
omv-mkconf collectd
omv-mkconf rrdcached
Afterwards you will have 2 new tabs which show graphs like these:
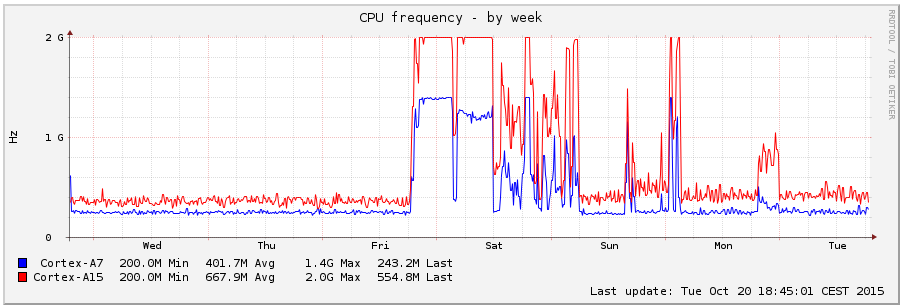
Finally reboot to see if everything is working as expected.
Benchmarks
All benchmarks were done with performance governor to get consistent results.
Disks
I have several USB disks connected to my Odroid. Expect one disk all are 2.5″ USB 3.0 disks. All USB 3.0 disks are connected to two active USB 3.0 hubs. The USB 2.0 disk is connected to the USB 2.0 port.
In the following you can find hdparm read and dd read/write benchmarks for all connected disks. As you can see the performance is quite good and should be near the maximum the disks can handle.
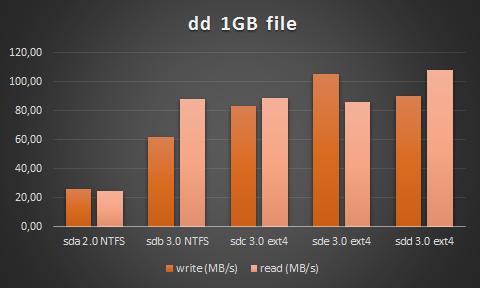
### Overview of HDDs ###
sda	USB 2.0		NTFS w big_writes	WD Elements 2,5" - 500GB
sdb	USB 3.0		NTFS w big_writes	Toshiba Canvio Basics - 2TB
sdc	USB 3.0		ext4			WD Elements 2,5" - 2TB
sdd	USB 3.0		ext4			Toshiba Stor.E Basics - 2TB
sde	USB 3.0		ext4			CnMemory Zinc 2,5" - 1TB


### hdparm results ###
hdparm -Tt /dev/sda
/dev/sda:
 Timing cached reads:   1846 MB in  2.00 seconds = 924.41 MB/sec
 Timing buffered disk reads:  74 MB in  3.06 seconds =  24.22 MB/sec

hdparm -Tt /dev/sdb
/dev/sdb:
 Timing cached reads:   1370 MB in  2.00 seconds = 685.57 MB/sec
 Timing buffered disk reads: 240 MB in  3.52 seconds =  68.26 MB/sec

hdparm -Tt /dev/sdc
/dev/sdc:
 Timing cached reads:   1898 MB in  2.00 seconds = 950.68 MB/sec
 Timing buffered disk reads: 306 MB in  3.01 seconds = 101.61 MB/sec

hdparm -Tt /dev/sdd
/dev/sdd:
 Timing cached reads:   1960 MB in  2.00 seconds = 981.68 MB/sec
 Timing buffered disk reads: 248 MB in  3.01 seconds =  82.50 MB/sec

hdparm -Tt /dev/sde

/dev/sde:
 Timing cached reads:   2024 MB in  2.00 seconds = 1013.57 MB/sec
 Timing buffered disk reads: 318 MB in  3.02 seconds = 105.41 MB/sec


### dd results ###

# sda
dd if=/dev/zero of=tempfile bs=1M count=1024 conv=fdatasync,notrunc
1024+0 records in
1024+0 records out
1073741824 bytes (1.1 GB) copied, 41.4705 s, 25.9 MB/s

echo 3 > /proc/sys/vm/drop_caches && dd if=tempfile of=/dev/null bs=1M count=1024
1024+0 records in
1024+0 records out
1073741824 bytes (1.1 GB) copied, 44.1483 s, 24.3 MB/s

# sdb
dd if=/dev/zero of=tempfile bs=1M count=1024 conv=fdatasync,notrunc
1024+0 records in
1024+0 records out
1073741824 bytes (1.1 GB) copied, 17.609 s, 61.0 MB/s

echo 3 > /proc/sys/vm/drop_caches && dd if=tempfile of=/dev/null bs=1M count=1024
1024+0 records in
1024+0 records out
1073741824 bytes (1.1 GB) copied, 12.2101 s, 87.9 MB/s

# sdc
dd if=/dev/zero of=tempfile bs=1M count=1024 conv=fdatasync,notrunc
1024+0 records in
1024+0 records out
1073741824 bytes (1.1 GB) copied, 12.9431 s, 83.0 MB/s

echo 3 > /proc/sys/vm/drop_caches && dd if=tempfile of=/dev/null bs=1M count=1024
1024+0 records in
1024+0 records out
1073741824 bytes (1.1 GB) copied, 12.1161 s, 88.6 MB/s

# sdd
dd if=/dev/zero of=tempfile bs=1M count=1024 conv=fdatasync,notrunc
1024+0 records in
1024+0 records out
1073741824 bytes (1.1 GB) copied, 10.2158 s, 105 MB/s

echo 3 > /proc/sys/vm/drop_caches && dd if=tempfile of=/dev/null bs=1M count=1024
1024+0 records in
1024+0 records out
1073741824 bytes (1.1 GB) copied, 12.531 s, 85.7 MB/s

# sde
dd if=/dev/zero of=tempfile bs=1M count=1024 conv=fdatasync,notrunc
1024+0 records in
1024+0 records out
1073741824 bytes (1.1 GB) copied, 11.9007 s, 90.2 MB/s

echo 3 > /proc/sys/vm/drop_caches && dd if=tempfile of=/dev/null bs=1M count=1024
1024+0 records in
1024+0 records out
1073741824 bytes (1.1 GB) copied, 9.95148 s, 108 MB/s
Network
All network settings are default OMV/debian settings.
Receive: 832 Mbit/s = 104 MByte/s
Send: 896 Mbit/s = 112 MByte/s
I am satisfied with these results as it is close to the theoretical maximum of 1Gbit/s.
# Server on Odroid
iperf -s -N

# Client on Thinkpad T430
# bidirectional test individually
iperf -c 192.168.0.2 -i 2 -r
------------------------------------------------------------
Server listening on TCP port 5001
TCP window size: 85.3 KByte (default)
------------------------------------------------------------
------------------------------------------------------------
Client connecting to 192.168.0.2, TCP port 5001
TCP window size:  323 KByte (default)
------------------------------------------------------------
[  5] local 192.168.0.118 port 56182 connected with 192.168.0.2 port 5001
[ ID] Interval       Transfer     Bandwidth
[  5]  0.0- 2.0 sec   200 MBytes   838 Mbits/sec
[  5]  2.0- 4.0 sec   198 MBytes   831 Mbits/sec
[  5]  4.0- 6.0 sec   198 MBytes   829 Mbits/sec
[  5]  6.0- 8.0 sec   198 MBytes   831 Mbits/sec
[  5]  8.0-10.0 sec   200 MBytes   838 Mbits/sec
[  5]  0.0-10.0 sec   994 MBytes   832 Mbits/sec
[  4] local 192.168.0.118 port 5001 connected with 192.168.0.2 port 44967
[  4]  0.0- 2.0 sec   207 MBytes   868 Mbits/sec
[  4]  2.0- 4.0 sec   215 MBytes   902 Mbits/sec
[  4]  4.0- 6.0 sec   216 MBytes   905 Mbits/sec
[  4]  6.0- 8.0 sec   214 MBytes   896 Mbits/sec
[  4]  8.0-10.0 sec   216 MBytes   907 Mbits/sec
[  4]  0.0-10.0 sec  1.04 GBytes   896 Mbits/sec


# bidirectional test simultaneously
iperf -c 192.168.0.2 -i 2 -d
------------------------------------------------------------
Server listening on TCP port 5001
TCP window size: 85.3 KByte (default)
------------------------------------------------------------
------------------------------------------------------------
Client connecting to 192.168.0.2, TCP port 5001
TCP window size:  289 KByte (default)
------------------------------------------------------------
[  5] local 192.168.0.118 port 56187 connected with 192.168.0.2 port 5001
[  4] local 192.168.0.118 port 5001 connected with 192.168.0.2 port 44808
[ ID] Interval       Transfer     Bandwidth
[  4]  0.0- 2.0 sec   125 MBytes   523 Mbits/sec
[  5]  0.0- 2.0 sec   100 MBytes   420 Mbits/sec
[  5]  2.0- 4.0 sec   109 MBytes   456 Mbits/sec
[  4]  2.0- 4.0 sec   110 MBytes   462 Mbits/sec
[  4]  4.0- 6.0 sec   112 MBytes   470 Mbits/sec
[  5]  4.0- 6.0 sec   108 MBytes   454 Mbits/sec
[  4]  6.0- 8.0 sec   118 MBytes   496 Mbits/sec
[  5]  6.0- 8.0 sec   105 MBytes   441 Mbits/sec
[  5]  8.0-10.0 sec   104 MBytes   436 Mbits/sec
[  4]  8.0-10.0 sec   119 MBytes   501 Mbits/sec
[  5]  0.0-10.0 sec   526 MBytes   441 Mbits/sec
[  4]  0.0-10.0 sec   587 MBytes   490 Mbits/sec
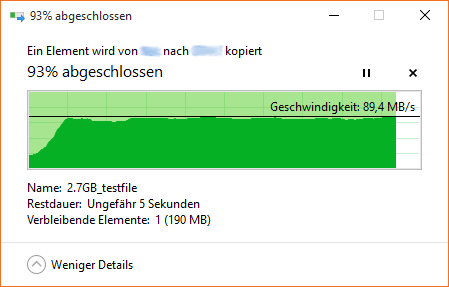
Samba
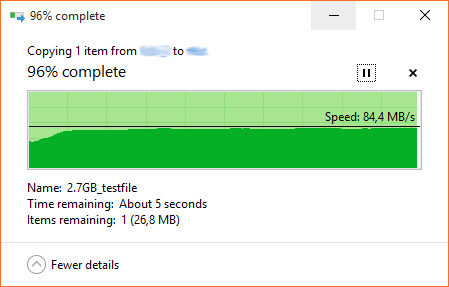
Disk and network speed looks fine. Because there are windows machines in my network I have to use samba to share files. As you can see samba speed is quite good and very stable.
Writing 2.7 GB test file to Odroid (USB 3.0 ext4 disk)
Reading 2.7 GB test file from Odroid (USB 3.0 ext4 disk)
If you have any additional questions feel free to ask 🙂
I will try to update this post regularly with new optimizations etc.
the biggest difference was in the governor settings. I’m getting about 104+ MB/sec now. I love you!
Well done!
I’m using an odroid xu 4q with an 7 years old WD My Book Essential 3TB USB 3.0 wich has a green line harddisk inside.
On my Gigabit LAN I’m getting up to 113Mb/s write speed with large files!!!
Thank you for this tutorial!
Hey thank you for this awesome post. I have an XU4Q and am trying to get the cputemp working. After following your directions and running a collectd -t I get the following output:
plugin_load: plugin “cpu” successfully loaded.
plugin_load: plugin “cpufreq” successfully loaded.
plugin_load: Could not find plugin “cputemp” in /usr/lib/collectd
plugin_load: plugin “df” successfully loaded.
plugin_load: plugin “disk” successfully loaded.
plugin_load: plugin “exec” successfully loaded.
plugin_load: plugin “interface” successfully loaded.
plugin_load: plugin “load” successfully loaded.
plugin_load: plugin “memory” successfully loaded.
plugin_load: plugin “rrdcached” successfully loaded.
Error: Reading the config file failed!
I looked in /usr/lib/collectd and there is a .so file for cpufreq and cpu, but nothing for cputemp.
Any help is much appreciated!
In the enable big writes section you said “Then you have to unmount, apply, mount, apply all your NTFS volumes in the web interface.” – Is there any way to do this without losing all your shared folders? Can I back up the shared folders, delete them, remount and then restore the shared folders?
Thanks for the great guide.
I have an HC2, looking at the status of sysfsutils I generally have:
“unknown attribute devices/system/cpu/cpu0/cpufreq/ondemand/up_threshold … failed!”
for all the entries of /etc/sysfs.conf,
Doing an ls of /sys/devices/system/cpu/cpu0/cpufreq/ shows that the directory “ondemand” doesn’t exist.
I can see there is “scaling available governers” and “scaling governer” amongst others, and doing a cpufreq-info -o shows that the governer has been set to “on demand”. Does this mean I can’t set these options on the HC2 ? –
Hi there,
I have hardkernel Ordoid HC2 (which is strip down XU4) and I wanted to add cpu grapht but id does not work on HC2 (obvoiusly fun is not there, but cpu clock and temp grpfs are empty as well). Could you tell me how to modify your scrips to get it works, please.
BTW you size increase for graphs worked very well.
Ivan & Johan:
Removing two files worked for me:
/usr/share/openmediavault/mkconf/collectd.d/cpufanspeed
and
/var/www/openmediavault/js/omv/module/admin/diagnostic/system/plugin/CpuFanSpeed.js
@Obihoernchen
any plans to update monitoring plugins for omv4?
they does not work
Wonderful thanks.
how i can remove cpu fan speed?
tnx
Same question here.
Installed the stuff on Odroid-HC1, which has no fan.
I too would appreciate instructions how to remove the fan-speed collectd and graph.
Thanksalot
Before you install the package you should remove all relevant files – search for CpuFanSpeed and execfan. AFAIR, there should be a .py plugin, a collectd config and a UX config. NB: If you have already installed the files you have to remove the config manually. For some reason executing the collectd refresh command that comes with the OMV does not remove old configs.